Let me start with the honest version.
When an enterprise leadership team says "we need an AI cluster," what they're actually asking for is a mission-critical distributed supercomputer that must survive hardware failures, network storms, storage bottlenecks, and GPU memory errors — while serving inference traffic at SLA and running model training overnight — all on top of infrastructure built by a team that has never done this before.
The gap between that ask and the reality of what it takes to deliver it is what this post is about.
I've spent the past several years designing and deploying AI training and inference clusters for enterprise customers at Cisco. Not the demo clusters. The real ones — the ones that run 24/7, that have SLAs, that serve production inference traffic, and that get called into incident bridges when something goes wrong at 2 AM.
What follows is the complete architecture picture: every layer, every critical decision, every resiliency and redundancy consideration, and the specific Cisco compute and networking configurations that make it work — including how to properly configure GPU resources on Kubernetes and OpenShift so your AI applications can actually scale to demand.
The Enterprise AI Architect's Reality
Before we get into the stack, I want to be clear about what the architect role actually looks like on these projects, because it's not what the vendor slides suggest.
You will be the person who has to answer: - "Why is GPU utilization at 40% when we paid for 100%?" — because the storage fabric can't feed the GPUs - "Why did training fail after 18 hours?" — because a single switch port dropped packets and RDMA stalled - "Why are inference latencies spiking?" — because you didn't configure the scheduler to isolate inference from batch jobs - "Can we add 10 more model serving replicas?" — only if you designed the load balancer and GPU resource quotas correctly from day one
You will be making decisions across:
- Physical server configuration (BIOS settings that affect NUMA topology)
- Network fabric architecture (non-blocking, lossless, RDMA-ready)
- Storage system design (parallel, NVMe-native, with dedicated bandwidth)
- Kubernetes/OpenShift cluster design (node pools, taints/tolerations, priority classes)
- GPU resource management (MIG, time-slicing, device plugins, operators)
- Observability and automated remediation
And you will be making all of these decisions simultaneously, with interdependencies between every layer.
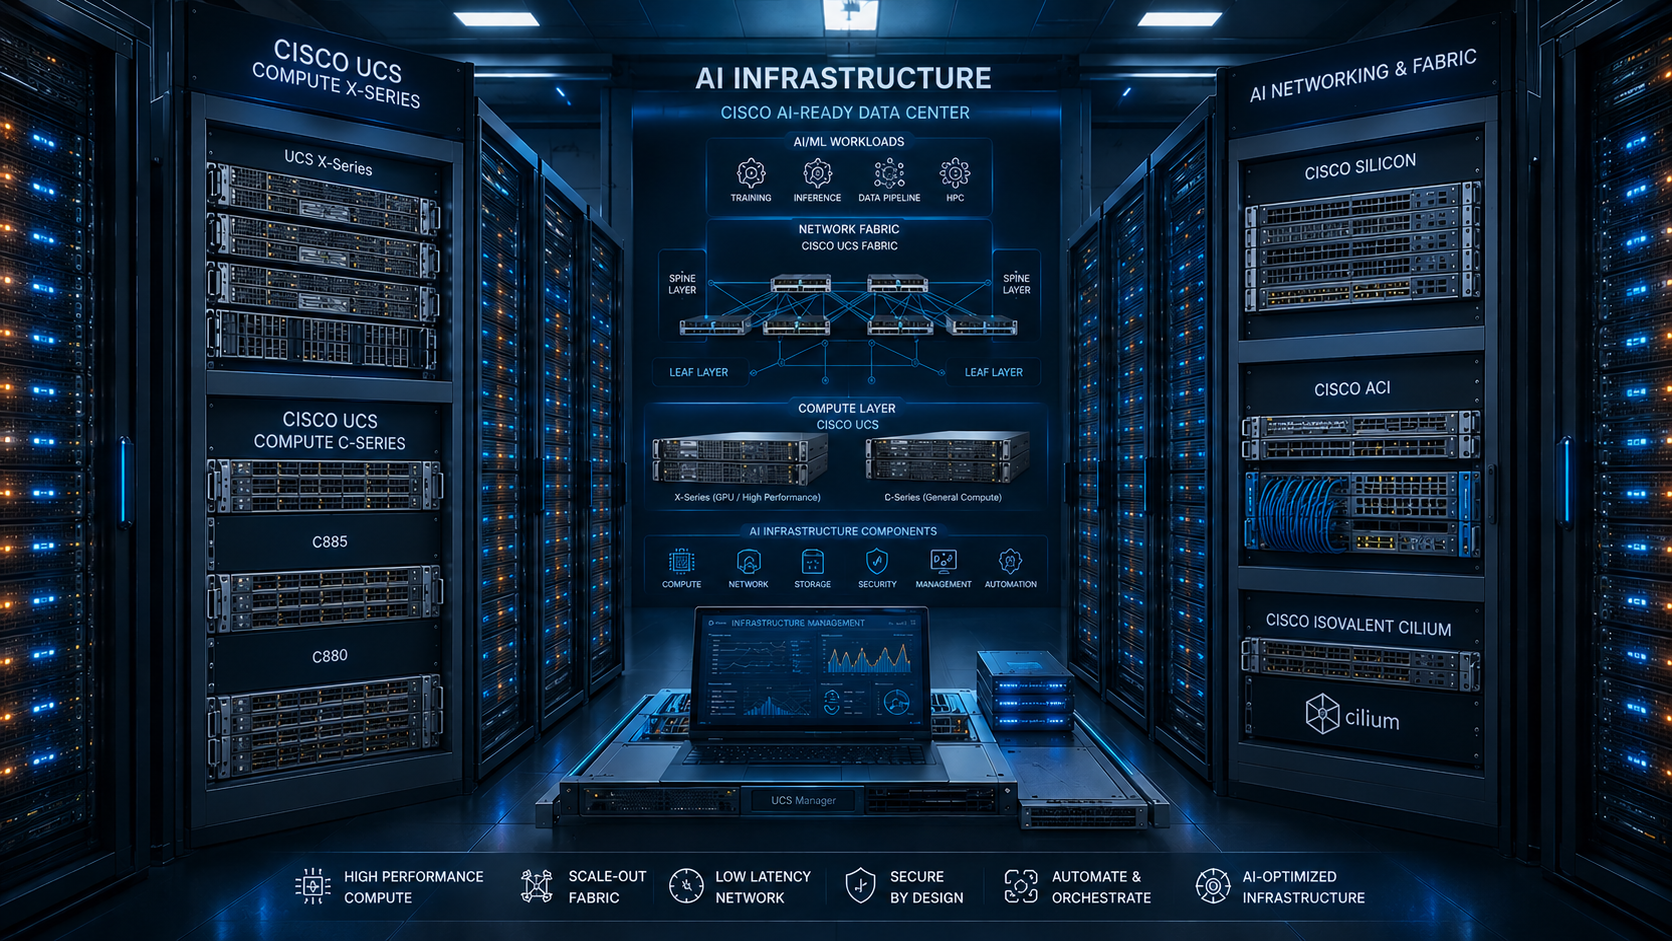
The AI Infrastructure Stack
Before we go deep, here's the complete picture of what we're building:
┌─────────────────────────────────────────────────────────────────────────────┐
│  8. Operations Layer                                                        │
│     Observability · Alerting · Automated Remediation · Runbooks             │
├─────────────────────────────────────────────────────────────────────────────┤
│  7. Platform Automation & Orchestration                                     │
│     Terraform · Ansible · Python · Cisco Intersight Automation              │
├─────────────────────────────────────────────────────────────────────────────┤
│  6. AI Platform Layer                                                       │
│     NVIDIA GPU Operator · Network Operator · NFD · MIG Manager              │
├─────────────────────────────────────────────────────────────────────────────┤
│  5. Container Orchestration + Resiliency                                    │
│     Red Hat OpenShift · GPU-aware Scheduling · Priority · Autoscaling       │
├─────────────────────────────────────────────────────────────────────────────┤
│  4. Compute Layer                                                           │
│     Cisco UCS X-Series / C-Series · H100/A100 · NVLink · NVSwitch          │
├─────────────────────────────────────────────────────────────────────────────┤
│  3. Backend Fabric — GPU-to-GPU                                             │
│     RoCE v2 · RDMA · PFC · ECN · Cisco Nexus 400G · Lossless Design        │
├─────────────────────────────────────────────────────────────────────────────┤
│  2. Storage Fabric                                                          │
│     NVMe-oF · VAST / Pure FlashBlade · Parallel FS · Checkpoint HA         │
├─────────────────────────────────────────────────────────────────────────────┤
│  1. Frontend Networking + Load Balancing                                    │
│     Ingress · Service Mesh · Inference LB · TLS · API Gateway               │
└─────────────────────────────────────────────────────────────────────────────┘
Each layer has its own failure modes, performance knobs, and resiliency requirements. Let's go through all of them.
Layer 1: Frontend Networking — Load Balancing, Ingress, and Inference Traffic
This is how users, APIs, and downstream services reach your AI workloads — model inference endpoints, Jupyter environments, monitoring dashboards, and MLOps pipelines.
What lives here
- Ingress controllers (NGINX, Istio Gateway, OpenShift Routes)
- Load balancers for inference API endpoints
- TLS termination, mTLS, and authentication
- API gateway for rate limiting and token-based access control
- Service mesh for east-west traffic (Istio, Red Hat Service Mesh)
The Architect's Load Balancing Decision
Inference traffic is extremely unlike general web traffic. A single GPU inference request for a large language model might hold a connection open for 5–30 seconds as tokens stream back. Standard round-robin load balancing fails here — it piles up sessions on backends regardless of whether they're busy.
What you actually need:
                      ┌─────────────────┐
          Users/APIs  │  API Gateway    │  ← Rate limiting, auth, quotas
                      └────────┬────────┘
                               │
                      ┌────────▼────────┐
                      │  Ingress / LB   │  ← Least-connections, session affinity
                      └──┬──────┬──────┘
                         │      │
              ┌──────────▼─┐  ┌─▼──────────┐
              │  vLLM Pod  │  │  vLLM Pod  │  ← GPU-backed inference replicas
              │  (GPU: 1)  │  │  (GPU: 1)  │
              └────────────┘  └────────────┘
- Use least-connection routing, not round-robin
- Enable session stickiness for stateful chat workloads
- Set timeout values appropriate for inference (60–300s, not the default 30s)
OpenShift Route / Ingress configuration for inference
# OpenShift Route for inference endpoint with timeout settings
apiVersion: route.openshift.io/v1
kind: Route
metadata:
  name: inference-api
  namespace: ai-inference
  annotations:
    haproxy.router.openshift.io/timeout: 300s
    haproxy.router.openshift.io/balance: leastconn
    haproxy.router.openshift.io/disable_cookies: "true"
spec:
  to:
    kind: Service
    name: vllm-inference-service
  port:
    targetPort: 8000
  tls:
    termination: edge
    insecureEdgeTerminationPolicy: Redirect
# Kubernetes Ingress for inference with NGINX annotations
apiVersion: networking.k8s.io/v1
kind: Ingress
metadata:
  name: inference-ingress
  namespace: ai-inference
  annotations:
    nginx.ingress.kubernetes.io/proxy-read-timeout: "300"
    nginx.ingress.kubernetes.io/proxy-send-timeout: "300"
    nginx.ingress.kubernetes.io/load-balance: "ewma"          # Exponentially Weighted Moving Average
    nginx.ingress.kubernetes.io/upstream-hash-by: "$remote_addr" # session affinity by client IP
spec:
  rules:
  - host: inference.ai.corp.example.com
    http:
      paths:
      - path: /v1
        pathType: Prefix
        backend:
          service:
            name: vllm-service
            port:
              number: 8000
Resiliency: What happens when an inference pod crashes?
- Deploy inference services with PodDisruptionBudgets so rolling upgrades don't take everything offline
- Use readiness probes that actually call the model's
/healthendpoint — don't trust TCP-level readiness for GPU processes
# PodDisruptionBudget for inference deployment
apiVersion: policy/v1
kind: PodDisruptionBudget
metadata:
  name: vllm-pdb
  namespace: ai-inference
spec:
  minAvailable: 1        # Always keep at least 1 inference replica up
  selector:
    matchLabels:
      app: vllm-inference

---
# Proper readiness probe for inference pods
readinessProbe:
  httpGet:
    path: /health
    port: 8000
  initialDelaySeconds: 90   # vLLM takes time to load model weights from storage
  periodSeconds: 10
  failureThreshold: 6
livenessProbe:
  httpGet:
    path: /health
    port: 8000
  initialDelaySeconds: 120
  periodSeconds: 30
  failureThreshold: 3
Layer 2: Storage Fabric — The Most Underestimated Layer
Training a large model means continuously streaming terabytes of data to GPUs. If your storage can't keep up, your GPUs idle — and idle GPUs at $30,000–$40,000 per unit are extraordinarily expensive.
The Throughput Equation
For large-scale training, you need:
| Training Scale | Minimum Storage Throughput | Recommended |
|---|---|---|
| Single node (8x H100) | 80 GB/s | 120 GB/s |
| 8-node pod (64x H100) | 640 GB/s | 1 TB/s |
| 32-node cluster (256x H100) | 2.5 TB/s | 4 TB/s+ (distributed) |
What we deploy
- VAST Data / Pure FlashBlade — all-NVMe parallel storage, millions of IOPS, single namespace
- NVMe over Fabrics (NVMe-oF) — extends NVMe locality performance across the network via RDMA
- Parallel file systems (WekaFS, GPFS/Spectrum Scale, Lustre) for distributed multi-node access
Validate storage before any GPU lands in the rack
# Validate NVMe-oF fabric throughput before training begins
# Run from multiple nodes simultaneously for aggregate measurement
fio --name=parallel-read \
    --rw=read \
    --bs=1M \
    --size=100G \
    --numjobs=32 \
    --iodepth=64 \
    --direct=1 \
    --group_reporting \
    --filename=/mnt/training-data/fio-test

# Target: >100 GB/s per node, >1 TB/s aggregate across 16 nodes
Resiliency: Checkpointing and Fault Tolerance
The single most painful experience in enterprise AI is a training job that fails after 18 hours without a checkpoint. The mitigation is architectural:
# PyTorch distributed training checkpoint configuration
# Save checkpoints frequently enough to minimize lost work
import torch
import torch.distributed as dist

CHECKPOINT_INTERVAL = 500          # Save every 500 steps
CHECKPOINT_PATH = "/mnt/checkpoints/run-001/"

def save_checkpoint(model, optimizer, step, loss):
    # Only rank 0 saves to avoid write contention
    if dist.get_rank() == 0:
        checkpoint = {
            'step': step,
            'model_state_dict': model.state_dict(),
            'optimizer_state_dict': optimizer.state_dict(),
            'loss': loss,
        }
        # Write to temp first, then atomic rename — avoids corrupt checkpoints
        tmp_path = f"{CHECKPOINT_PATH}/checkpoint-{step}.tmp"
        final_path = f"{CHECKPOINT_PATH}/checkpoint-{step}.pt"
        torch.save(checkpoint, tmp_path)
        os.rename(tmp_path, final_path)
    dist.barrier()    # All ranks wait before continuing
Storage resiliency requirements: - Dual-controller NVMe arrays — no single controller failures affecting training - Replicated checkpoint volumes — checkpoints should be on a different failure domain from training data - Separate network paths for training data vs. checkpoints — don't let checkpoint writes starve training reads
Persistent Volume setup on OpenShift for AI workloads
# StorageClass for high-performance training data (NVMe-oF backed)
apiVersion: storage.k8s.io/v1
kind: StorageClass
metadata:
  name: ai-training-nvmeof
provisioner: csi.trident.netapp.io     # or pure-csi, vast-csi
parameters:
  mediaType: "nvme"
  replication: "2"
  fsType: "ext4"
reclaimPolicy: Retain
volumeBindingMode: WaitForFirstConsumer
allowVolumeExpansion: true

---
# PVC for training dataset (large, ReadWriteMany for distributed access)
apiVersion: v1
kind: PersistentVolumeClaim
metadata:
  name: training-dataset-pvc
  namespace: ai-training
spec:
  accessModes:
    - ReadWriteMany         # All training pods read simultaneously
  storageClassName: ai-training-nvmeof
  resources:
    requests:
      storage: 10Ti

---
# PVC for checkpoints (dedicated, isolated from training data reads)
apiVersion: v1
kind: PersistentVolumeClaim
metadata:
  name: checkpoint-pvc
  namespace: ai-training
spec:
  accessModes:
    - ReadWriteMany
  storageClassName: ai-checkpoint-ha
  resources:
    requests:
      storage: 2Ti
Layer 3: Backend Fabric — The GPU-to-GPU Network (Where AI Jobs Live or Die)
This is the most technically demanding layer and the one that separates a functional AI cluster from a high-performance one. It's also the layer where most enterprise teams make their most expensive mistakes.
The Problem
During distributed training, GPUs on different nodes exchange gradients continuously — billions of floating-point numbers at microsecond intervals. This is the AllReduce collective communication operation at the core of distributed deep learning.
Standard TCP/IP networking adds CPU overhead and latency that kills throughput by 30–60%. A 100-GPU training job that should take 10 hours takes 25 hours — not because GPUs are slow, but because the network can't keep up.
The Solution: RoCE v2 (RDMA over Converged Ethernet)
RDMA allows the network adapter to transfer data directly between GPU memory on different nodes — bypassing the CPU and OS networking stack entirely.
Node A                                        Node B
┌──────────────────────────┐                 ┌──────────────────────────┐
│  GPU 0 HBM (activations) │  RoCE v2 RDMA   │  GPU 0 HBM (gradients)   │
│                          ├─────────────────►│                          │
└──────────────────────────┘  400GbE / NIC    └──────────────────────────┘
      ↑ No CPU, No OS kernel involvement ↑
Cisco Nexus Switch Configuration for RoCE v2
RoCE is unforgiving of ANY packet loss. A single dropped packet causes RDMA to stall and recover — which on a 1000-GPU job means the entire collective communication pauses. The fabric must be lossless.
# ─────────────────────────────────────────────────────────────────
# Cisco Nexus 9336C-FX2 / 9364C-GX — AI Fabric QoS Configuration
# ─────────────────────────────────────────────────────────────────

# Step 1: Enable Priority Flow Control (PFC)
# PFC pauses individual traffic classes instead of dropping packets
# RoCE traffic must NEVER see packet drops — PFC is not optional

interface Ethernet 1/1-48
  priority-flow-control mode on
  priority-flow-control watch-dog-interval off

# Step 2: Enable Explicit Congestion Notification (ECN)
# ECN marks packets before buffers overflow — enables senders to back off
# without drops. Works with DCQCN (Data Center Quantized Congestion Notification)

hardware qos ecn
hardware qos ecn threshold 20 80   # Start marking at 20%, aggressive at 80%

# Step 3: DSCP Class of Service mapping
# RoCE traffic tagged DSCP 26 gets dedicated COS queue
class-map type qos match-all RDMA-CLASS
  match dscp 26

policy-map type qos AI-RDMA-INBOUND
  class RDMA-CLASS
    set qos-group 3

# Step 4: Buffer allocation
# AI fabric needs deep buffers — 32MB+ per port for burst absorption
hardware profile portmode
  buffer-boost

# Step 5: Verify PFC is negotiated end-to-end
show interface ethernet 1/1-8 priority-flow-control
show queuing interface ethernet 1/1
Cisco Nexus Fabric Topology for AI Clusters
                    ┌────────────────────────────────────────────────────┐
                    │              SPINE LAYER                           │
                    │    2x Cisco Nexus 9364C-GX (400GbE, non-blocking) │
                    │         VPC peer-link for redundancy               │
                    └──────┬──────────────────┬───────────────────┬──────┘
                           │                  │                   │
              ┌────────────▼──────┐  ┌────────▼──────┐  ┌────────▼──────┐
              │  Leaf ToR 1       │  │  Leaf ToR 2   │  │  Leaf ToR 3   │
              │  Nexus 9336C-FX2  │  │  9336C-FX2    │  │  9336C-FX2    │
              │  2x 400G uplinks  │  │  2x 400G up   │  │  2x 400G up   │
              └──────┬────────────┘  └────────┬──────┘  └────────┬──────┘
                     │                        │                   │
              ┌──────▼──────┐         ┌───────▼─────┐    ┌───────▼─────┐
              │ UCS Servers │         │ UCS Servers │    │ UCS Servers │
              │ Rack A      │         │ Rack B      │    │ Rack C      │
              │ 8x H100 ea  │         │ 8x H100 ea  │    │ 8x H100 ea  │
              │ 400GbE RoCE │         │ 400GbE RoCE │    │ 400GbE RoCE │
              └─────────────┘         └─────────────┘    └─────────────┘
Redundancy decisions you must make: - Dual spine for redundancy — single spine is a cluster-wide single point of failure - Dual-home every server — two 200GbE uplinks bonded with LACP, or two separate 400GbE for RDMA active-active - vPC (Virtual Port Channel) on leaf switches — eliminates spanning tree from your AI fabric path - ECMP across spine uplinks — distribute RoCE flows evenly across all spine paths
Sizing the Fabric
| Cluster Scale | Switch Requirement | Per-Server Bandwidth |
|---|---|---|
| 8–16 servers | 1x Nexus 9336C-FX2 (leaf only) | 2x 200GbE |
| 32–64 servers | 2-tier leaf-spine, 9364C-GX spine | 400GbE |
| 128+ servers | 3-tier, dedicated spine per pod | 400GbE × 2 |
Verify your fabric BEFORE training:
# RDMA bandwidth test between two nodes — should reach >350 Gbps on 400GbE
ib_write_bw --rdma_cm -d mlx5_0 -x 3 --report_gbits <remote_ip>

# Check for PFC pause frames — if these are high, buffer tuning needed
ethtool -S eth0 | grep -i pause
show queuing interface ethernet 1/1 | include pause
Layer 4: Cisco Compute — UCS Design for AI Workloads
The physical compute is where most teams start the conversation, but it's more nuanced than picking a GPU model. The server configuration — BIOS, NUMA topology, PCIe topology, and Fabric Interconnect policies — dramatically affects what the upper layers can achieve.
Cisco UCS Server Selection
For AI Training: - Cisco UCS X210c M7 (X-Series blade) — 2x Intel Xeon Scalable 4th Gen + up to 4x NVIDIA H100 SXM5, managed through UCS X9508 chassis - Cisco UCS C240 M7 (rack server) — 2x Xeon + 8x PCIe slots, supports 8x A100/H100 PCIe variants - Cisco UCS C245 M8 — 2x AMD EPYC 9004 + 8x NVIDIA H100 NVL — optimal for large memory/GPU ratio
For AI Inference: - Cisco UCS C220 M7 — 1–2x GPU inference workloads, cost-optimized - Cisco UCS C245 M8 — high GPU density for inference at scale with MIG slicing
Server Configuration: What the BIOS Settings Actually Do
Most teams take default BIOS settings and wonder why RDMA or NVMe performance is 40% below expectations.
# Cisco UCS BIOS Policy settings critical for AI workloads
# Configure via Intersight Server Policy → BIOS Policy

NUMA: Enabled
  └─ GPUs and NICs must be on same NUMA node as the PCIe bus
     Crossing NUMA boundaries adds ~200ns latency to every GPU operation

CPU Power Management: Maximum Performance
  └─ Disables P-states and C-states that throttle CPU during GPU coordination

Hyper-Threading: Disabled (for training workloads)
  └─ GPU training processes don't benefit from HT; reduces scheduling jitter

Memory: Bandwidth Optimized → All DIMMs populated per channel

Transparent Huge Pages: Always
  └─ Reduces TLB pressure for GPU DMA memory operations

SR-IOV: Enabled
  └─ Required for GPU direct RDMA (GDR) and NIC SR-IOV for Kubernetes
Intersight Server Profile — Infrastructure-as-Code Approach
Managing UCS server configuration manually doesn't scale past 10 servers. The correct answer is Intersight Server Profiles applied consistently via the Intersight API.
# Python: Create UCS Server Profile for AI node via Intersight API
import intersight
from intersight.api import server_api, vnic_api, bios_api

def create_ai_server_profile(api_client, server_moid: str, profile_name: str):
    """Create a complete AI-optimized UCS Server Profile"""

    server_client = server_api.ServerApi(api_client)

    # 1. Create the server profile
    profile = {
        "Name": profile_name,
        "Description": "AI Training/Inference Node — GPU Optimized",
        "TargetPlatform": "FIAttached",
        "Tags": [
            {"Key": "Role", "Value": "ai-gpu"},
            {"Key": "ManagedBy", "Value": "intersight-automation"}
        ]
    }

    # 2. Attach BIOS policy (pre-created AI BIOS policy)
    # 3. Attach vNIC policy (RDMA-capable, 2x 100GbE or 400GbE)
    # 4. Attach storage policy (local NVMe for scratch space)
    # 5. Assign to physical server and deploy

    print(f"Deployed profile {profile_name} to server {server_moid}")
Cisco UCS Fabric Interconnect — The Control Plane
All UCS blade and rack servers connect through Cisco UCS Fabric Interconnects (FI). For AI clusters, this means:
- UCS 6536 Fabric Interconnect — 36x 100GbE ports, supports 400GbE unified ports
- Pair the FIs for redundancy — each server gets one path to FI-A and one to FI-B
- Unified ports — same physical ports carry FCoE (for storage) and Ethernet (for RDMA) without separate adapters
- VIC (Virtual Interface Card) — Cisco VIC 15425 or 15231 provides SR-IOV capability and hardware-level RoCE support
                    ┌─────────────────────────────────────────┐
                    │         Cisco UCS Fabric Interconnects  │
                    │   FI-A (active)    │   FI-B (standby)   │
                    └──────────┬─────────┴───────┬────────────┘
                               │                 │
              ┌────────────────▼─────────────────▼──────────────────┐
              │              UCS X9508 Chassis                       │
              │  ┌─────────────┐   ┌─────────────┐   ┌──────────┐  │
              │  │ X210c M7 #1 │   │ X210c M7 #2 │   │  ...     │  │
              │  │ 4x H100 SXM │   │ 4x H100 SXM │   │          │  │
              │  │ Cisco VIC   │   │ Cisco VIC   │   │          │  │
              │  └─────────────┘   └─────────────┘   └──────────┘  │
              └──────────────────────────────────────────────────────┘
Training vs Inference Compute Sizing
| Workload | Recommended Server | GPU Config | Memory | Backend Network |
|---|---|---|---|---|
| LLM Pre-training | UCS X210c M7 | 4x H100 SXM5 80GB | 2TB+ DRAM | 400GbE RoCE |
| LLM Fine-tuning | UCS C240 M7 | 8x A100 PCIe 80GB | 1TB DRAM | 100GbE RoCE |
| LLM Inference | UCS C245 M8 | 8x H100 NVL 94GB | 768GB DRAM | 100GbE |
| Multi-tenant Inference | UCS C220 M7 | 2x H100 (MIG) | 384GB DRAM | 25GbE |
NVLink and NVSwitch — Within-Node GPU Interconnect
For within-node GPU-to-GPU data movement, NVLink (H100 SXM version) provides 900 GB/s bidirectional bandwidth — 9x faster than PCIe Gen5. This matters enormously for model parallelism where layers are split across GPUs in the same node.
# Verify NVLink topology and health on each server
nvidia-smi nvlink --status
nvidia-smi nvlink --capabilities

# Check NVLink bandwidth (should show ~450 GB/s per direction)
dcgmi dmon -s nvlink_bw
Critical: H100 SXM5 uses NVSwitch for full all-to-all GPU connectivity within a node. H100 PCIe does not have NVSwitch — GPUs communicate through the CPU PCIe bus, significantly lower performance. This distinction is often missed when procurement happens separately from architecture design.
Layer 5: Container Orchestration — Kubernetes & OpenShift Done Right for AI
Every enterprise AI cluster we deploy runs on Red Hat OpenShift (Kubernetes). It's the layer that ties compute, networking, and storage together and gives you scheduling, multi-tenancy, and lifecycle management at scale.
This is also the layer where AI-specific configuration is most frequently wrong — and where wrong configuration means your powerful and expensive GPU hardware sits underutilized.
Why OpenShift for Enterprise AI
- Integrated security — Security Context Constraints (SCC), built-in image scanning, OPA Gatekeeper policies
- Operator framework — GPU Operator, Network Operator, NFD all deploy cleanly on OCP
- Red Hat AI/ML stack — OpenShift AI (RHOAI) for MLOps workflows on top
- Enterprise support + SLA — critical when your production inference cluster has an incident
- Certified GPU node support — NVIDIA certifies their operators for OpenShift specifically
Cluster Design for AI Workloads
You should never mix AI training and inference workloads on the same node pool as general application workloads. Design three node pools minimum:
OpenShift Cluster
├── Infrastructure Nodes (3x)        # etcd, API server, monitoring, ingress
│   └── No GPU, standard CPU servers
├── GPU Training Pool                # Large GPU nodes for training jobs
│   ├── Node: ucs-gpu-train-01 (8x H100 SXM5)
│   ├── Node: ucs-gpu-train-02 (8x H100 SXM5)
│   └── Taints: nvidia.com/gpu=training:NoSchedule
├── GPU Inference Pool               # MIG-enabled nodes for inference serving
│   ├── Node: ucs-gpu-inf-01 (MIG 7x 1g.10gb per H100)
│   ├── Node: ucs-gpu-inf-02 (MIG 7x 1g.10gb per H100)
│   └── Taints: nvidia.com/gpu=inference:NoSchedule
└── CPU Worker Pool                  # General workloads, data preprocessing
    └── Standard CPU-only nodes
Defining node taints and labels:
# Label GPU training nodes
oc label node ucs-gpu-train-01 node-role.kubernetes.io/gpu-training=''
oc label node ucs-gpu-train-01 accelerator=h100-sxm5
oc label node ucs-gpu-train-01 nvidia.com/gpu.product=NVIDIA-H100-SXM5-80GB

# Taint training nodes — only workloads that explicitly tolerate can schedule here
oc adm taint node ucs-gpu-train-01 nvidia.com/gpu=training:NoSchedule

# Label inference nodes separately
oc label node ucs-gpu-inf-01 node-role.kubernetes.io/gpu-inference=''
oc adm taint node ucs-gpu-inf-01 nvidia.com/gpu=inference:NoSchedule
Priority Classes — Making Workloads Coexist
Without priority classes, a low-priority batch preprocessing job can consume resources that your production inference service needs. Define priorities explicitly.
# Priority class definitions — apply at cluster level
apiVersion: scheduling.k8s.io/v1
kind: PriorityClass
metadata:
  name: ai-inference-critical
value: 1000000
globalDefault: false
description: "Production inference serving — never preempted"

---
apiVersion: scheduling.k8s.io/v1
kind: PriorityClass
metadata:
  name: ai-training-high
value: 500000
globalDefault: false
description: "Scheduled training jobs"

---
apiVersion: scheduling.k8s.io/v1
kind: PriorityClass
metadata:
  name: ai-batch-low
value: 100000
globalDefault: false
description: "Data preprocessing and experiment runs — can be preempted"
# Inference deployment using critical priority
apiVersion: apps/v1
kind: Deployment
metadata:
  name: vllm-inference
  namespace: ai-inference
spec:
  replicas: 4
  template:
    spec:
      priorityClassName: ai-inference-critical   # Cannot be preempted
      tolerations:
      - key: "nvidia.com/gpu"
        operator: "Equal"
        value: "inference"
        effect: "NoSchedule"
      nodeSelector:
        node-role.kubernetes.io/gpu-inference: ''
      containers:
      - name: vllm
        image: vllm/vllm-openai:latest
        resources:
          limits:
            nvidia.com/mig-1g.10gb: "1"     # One MIG slice per replica
          requests:
            nvidia.com/mig-1g.10gb: "1"
            memory: "32Gi"
            cpu: "8"
ResourceQuotas for GPU Multi-Tenancy
When multiple teams share a GPU cluster, you must control how many GPUs each team can consume. Without quotas, one team's batch job can starve another's production inference.
# Namespace-level ResourceQuota for each team
apiVersion: v1
kind: ResourceQuota
metadata:
  name: team-alpha-gpu-quota
  namespace: team-alpha
spec:
  hard:
    requests.nvidia.com/gpu: "16"          # Max 16 whole GPUs
    limits.nvidia.com/gpu: "16"
    requests.nvidia.com/mig-1g.10gb: "32" # Or 32 MIG slices
    limits.nvidia.com/mig-1g.10gb: "32"
    requests.memory: "512Gi"
    requests.cpu: "128"
    persistentvolumeclaims: "10"
    requests.storage: "20Ti"

---
# LimitRange to prevent individual pods from grabbing too many GPUs
apiVersion: v1
kind: LimitRange
metadata:
  name: gpu-limit-range
  namespace: team-alpha
spec:
  limits:
  - type: Container
    max:
      nvidia.com/gpu: "4"    # No single container gets more than 4 GPUs
    default:
      nvidia.com/gpu: "1"
Horizontal Pod Autoscaler for Inference
Inference traffic is highly variable. The HPA scales GPU pods based on request queue depth or custom metrics from Prometheus.
# Scale inference pods based on GPU utilization (from DCGM exporter)
apiVersion: autoscaling/v2
kind: HorizontalPodAutoscaler
metadata:
  name: vllm-inference-hpa
  namespace: ai-inference
spec:
  scaleTargetRef:
    apiVersion: apps/v1
    kind: Deployment
    name: vllm-inference
  minReplicas: 2
  maxReplicas: 14                        # Bounded by available MIG slices
  metrics:
  - type: Pods
    pods:
      metric:
        name: dcgm_fi_dev_gpu_util       # GPU utilization from DCGM
      target:
        type: AverageValue
        averageValue: "70"               # Scale up when avg GPU util > 70%
  behavior:
    scaleUp:
      stabilizationWindowSeconds: 60     # Respond quickly to load spikes
      policies:
      - type: Pods
        value: 2
        periodSeconds: 60
    scaleDown:
      stabilizationWindowSeconds: 300    # Be conservative scaling down
      policies:
      - type: Pods
        value: 1
        periodSeconds: 120
Layer 6: Configuring GPU Resources on Kubernetes/OpenShift — The Detail Most Teams Get Wrong
This is the layer most teams jump to first and the one that fails most visibly when the layers below it aren't solid. But even when the foundation is right, there is substantial configuration required to make GPUs work correctly and reliably inside Kubernetes.
Step 1: Node Feature Discovery (NFD) — Non-Negotiable
NFD scans every node and creates Kubernetes labels describing the hardware capabilities: GPU model, driver version, RDMA capability, NVMe presence, NUMA topology, and more. The GPU Operator and gpu-aware scheduler depend on these labels. Without NFD, scheduling is blind.
# Install NFD via Operator on OpenShift
oc apply -f - <<EOF
apiVersion: operators.coreos.com/v1alpha1
kind: Subscription
metadata:
  name: nfd
  namespace: openshift-nfd
spec:
  channel: stable
  name: nfd
  source: redhat-operators
  sourceNamespace: openshift-marketplace
EOF

# Verify NFD labels applied to GPU nodes
oc get node ucs-gpu-train-01 -o json | jq '.metadata.labels | to_entries[] | select(.key | startswith("feature.node.kubernetes.io"))'
# Should show: gpu model, driver, PCIe topology, RDMA, NVMe, NUMA details
Step 2: NVIDIA GPU Operator — Full Configuration
The GPU Operator automates driver installation, CUDA toolkit, device plugin, MIG manager, and DCGM metrics — all as containers. No baremetal software installation required.
# Install GPU Operator via Helm on OpenShift
helm repo add nvidia https://helm.ngc.nvidia.com/nvidia
helm repo update

# Full production configuration
helm install gpu-operator nvidia/gpu-operator \
  --namespace gpu-operator \
  --create-namespace \
  --set driver.enabled=true \
  --set driver.version="550.54.15" \
  --set toolkit.enabled=true \
  --set devicePlugin.enabled=true \
  --set mig.strategy=mixed \          # Support both whole GPUs and MIG slices simultaneously
  --set dcgmExporter.enabled=true \
  --set dcgmExporter.serviceMonitor.enabled=true \   # Scrape by Prometheus
  --set gfd.enabled=true \            # GPU Feature Discovery
  --set nodeStatusExporter.enabled=true \
  --set validator.plugin.env[0].name=WITH_WORKLOAD \
  --set validator.plugin.env[0].value="true"

# Watch GPU Operator pods come up — this takes 5-10 min on first boot
kubectl get pods -n gpu-operator -w
Expected running pods after installation:
NAME                                              READY   STATUS
gpu-feature-discovery-<node>                      1/1     Running   # Labels GPU capabilities
nvidia-container-toolkit-daemonset-<node>         1/1     Running   # Container runtime hookup
nvidia-dcgm-exporter-<node>                       1/1     Running   # Prometheus metrics
nvidia-device-plugin-daemonset-<node>             1/1     Running   # Exposes GPUs as K8s resources
nvidia-driver-daemonset-<node>                    1/1     Running   # NVIDIA kernel driver
nvidia-mig-manager-<node>                         1/1     Running   # MIG partition management
nvidia-operator-validator-<node>                  1/1     Running   # Validates GPU access
Step 3: MIG Configuration — GPU Multi-Instance for Inference
A single H100 GPU can be partitioned into up to 7 independent MIG instances, each with isolated compute, memory bandwidth, and cache. For inference serving, this is the most important GPU resource management tool available.
MIG Instance Profiles on H100 (80GB):
| Profile | GPU Compute | Memory | Instances per GPU | Use Case |
|---|---|---|---|---|
1g.10gb |
1/7 | 10GB | 7 | Small model inference, batch embed |
2g.20gb |
2/7 | 20GB | 3 | Medium model inference |
3g.40gb |
3/7 | 40GB | 2 | Large model, max 2 per GPU |
7g.80gb |
7/7 | 80GB | 1 | Full GPU (training or huge models) |
Configuring MIG via GPU Operator MIG Manager:
# MIG configuration ConfigMap — applied per node via labels
# This tells MIG Manager what partition scheme to create on each node
apiVersion: v1
kind: ConfigMap
metadata:
  name: mig-parted-config
  namespace: gpu-operator
data:
  config.yaml: |
    version: v1
    mig-configs:
      # Inference node: 7 small instances per GPU for maximum density
      inference-dense:
        - devices: all
          mig-enabled: true
          mig-devices:
            "1g.10gb": 7            # 7x small inference per H100

      # Mixed node: some training, some inference
      mixed-workload:
        - devices: [0,1,2,3]        # First 4 GPUs: full for training
          mig-enabled: false
        - devices: [4,5,6,7]        # Last 4 GPUs: MIG for inference
          mig-enabled: true
          mig-devices:
            "2g.20gb": 3
            "1g.10gb": 1

      # Training node: MIG disabled, whole GPUs
      training-full:
        - devices: all
          mig-enabled: false
# Apply MIG config to inference nodes via node label
oc label node ucs-gpu-inf-01 nvidia.com/mig.config=inference-dense

# Verify MIG instances created
nvidia-smi -L
# GPU 0: NVIDIA H100 SXM5 80GB (UUID: GPU-...)
#   MIG 1g.10gb Device 0: (UUID: MIG-...)
#   MIG 1g.10gb Device 1: (UUID: MIG-...)
#   ... (7 total)

# Verify K8s can see MIG resources
kubectl describe node ucs-gpu-inf-01 | grep -A 20 "Capacity:"
# nvidia.com/mig-1g.10gb: 7     ← 7 MIG slices available for scheduling
Step 4: NVIDIA Network Operator — RDMA for Kubernetes Pods
For distributed training, Kubernetes pods need direct RDMA access to the RoCE fabric. The Network Operator configures SR-IOV virtual functions and Multus CNI so each training pod gets its own dedicated RDMA interface.
# Install Network Operator
helm install network-operator nvidia/network-operator \
  --namespace nvidia-network-operator \
  --create-namespace \
  --set deployCR=true \
  --set rdmaSharedDevicePlugin.deploy=true \
  --set sriovDevicePlugin.deploy=true \
  --set multus.deploy=true \
  --set whereabouts.deploy=true      # IP address management for secondary interfaces
# SriovNetworkNodePolicy — creates SR-IOV VFs from the RDMA NIC
apiVersion: sriovnetwork.openshift.io/v1
kind: SriovNetworkNodePolicy
metadata:
  name: mlx-rdma-policy
  namespace: sriov-network-operator
spec:
  resourceName: mlnx_rdma                    # How pods request this resource
  nodeSelector:
    feature.node.kubernetes.io/network-sriov.capable: "true"
  numVfs: 8                                  # 8 SR-IOV virtual functions per physical port
  nicSelector:
    pfNames: ["ens4f0"]                      # The RDMA-capable physical port
    vendor: "15b3"                           # Mellanox/NVIDIA NIC vendor ID
  deviceType: netdevice
  isRdma: true                               # Enable RDMA on VFs

---
# SriovNetwork — network attachment for pods
apiVersion: sriovnetwork.openshift.io/v1
kind: SriovNetwork
metadata:
  name: rdma-network
  namespace: sriov-network-operator
spec:
  resourceName: mlnx_rdma
  networkNamespace: ai-training
  ipam: |
    {
      "type": "whereabouts",
      "range": "192.168.100.0/24"
    }
# Training pod with full GPU + RDMA interface
apiVersion: v1
kind: Pod
metadata:
  name: training-job-worker-0
  namespace: ai-training
  annotations:
    k8s.v1.cni.cncf.io/networks: rdma-network     # Attach RDMA secondary interface
spec:
  priorityClassName: ai-training-high
  tolerations:
  - key: "nvidia.com/gpu"
    operator: "Equal"
    value: "training"
    effect: "NoSchedule"
  nodeSelector:
    node-role.kubernetes.io/gpu-training: ''
    nvidia.com/gpu.product: "NVIDIA-H100-SXM5-80GB"
  containers:
  - name: trainer
    image: nvcr.io/nvidia/pytorch:24.01-py3
    resources:
      limits:
        nvidia.com/gpu: "8"              # All 8 GPUs on the node
        mlnx_rdma: "1"                   # One RDMA SR-IOV VF
        memory: "1800Gi"
        cpu: "128"
      requests:
        nvidia.com/gpu: "8"
        mlnx_rdma: "1"
        memory: "1800Gi"
        cpu: "128"
    env:
    - name: NCCL_P2P_DISABLE
      value: "0"
    - name: NCCL_IB_DISABLE
      value: "0"                        # Enable IB/RoCE (0 = enabled)
    - name: NCCL_DEBUG
      value: "WARN"
    - name: NCCL_IB_HCA
      value: "^mlx5"                    # Use Mellanox RDMA HCA
    - name: NCCL_SOCKET_IFNAME
      value: "eth0"                     # Control plane interface
    volumeMounts:
    - name: training-data
      mountPath: /data
    - name: checkpoints
      mountPath: /checkpoints
    - name: shm                         # Shared memory for NCCL
      mountPath: /dev/shm
  volumes:
  - name: training-data
    persistentVolumeClaim:
      claimName: training-dataset-pvc
  - name: checkpoints
    persistentVolumeClaim:
      claimName: checkpoint-pvc
  - name: shm
    emptyDir:
      medium: Memory
      sizeLimit: "32Gi"                 # Large shared memory for NCCL allreduce
Step 5: GPU Time-Slicing (Alternative to MIG for Older GPUs)
For A100 or older GPUs that don't support MIG, time-slicing allows multiple containers to share a GPU — though without memory isolation (all tenants see the same GPU memory space, so this works for smaller models only).
# ConfigMap for GPU time-slicing
apiVersion: v1
kind: ConfigMap
metadata:
  name: time-slicing-config
  namespace: gpu-operator
data:
  any: |
    version: v1
    flags:
      migStrategy: none
    sharing:
      timeSlicing:
        renameByDefault: false
        failRequestsGreaterThanOne: false
        resources:
        - name: nvidia.com/gpu
          replicas: 4        # 4 pods can share each GPU (time-sliced)
# Apply time-slicing to nodes that don't support MIG
oc label node ucs-gpu-a100-01 nvidia.com/device-plugin.config=time-slicing-config
Step 6: Monitoring GPU Utilization on OpenShift
Install the DCGM metrics stack to have visibility into what every GPU is actually doing.
# ServiceMonitor to scrape DCGM Exporter metrics into Prometheus
apiVersion: monitoring.coreos.com/v1
kind: ServiceMonitor
metadata:
  name: dcgm-exporter-monitor
  namespace: gpu-operator
  labels:
    app: dcgm-exporter
spec:
  selector:
    matchLabels:
      app: dcgm-exporter
  endpoints:
  - port: metrics
    interval: 15s
    path: /metrics
Critical DCGM metrics to watch and alert on:
| Metric | Alert Threshold | Meaning |
|---|---|---|
DCGM_FI_DEV_GPU_UTIL |
< 70% (sustained) | GPUs underutilized — likely storage or network bottleneck |
DCGM_FI_DEV_FB_USED |
> 90% | Near GPU OOM — risk of training crash |
DCGM_FI_DEV_NVLINK_BANDWIDTH_TOTAL |
< 50% of peak | NVLink underutilized — check NCCL configuration |
DCGM_FI_DEV_POWER_USAGE |
> 700W (H100 TDP) | Thermal throttling risk |
DCGM_FI_DEV_ECC_SBE_VOL_TOTAL |
> 0 (growing) | GPU memory single-bit errors — early hardware warning |
DCGM_FI_DEV_ECC_DBE_VOL_TOTAL |
> 0 | Double-bit uncorrectable errors — node needs replacement |
# Quick GPU health check across all cluster nodes
kubectl exec -n gpu-operator dcgm-exporter-<pod> -- dcgmi diag -r 1
# Runs hardware diagnostics on all GPUs simultaneously
Layer 7: Platform Automation & Orchestration — Making It Repeatable
At 8 servers you can configure things manually. At 80 servers, you cannot. Every configuration decision made in layers 1–6 must be codified so it can be applied consistently, audited, and reproduced.
Cisco Intersight as the Control Plane
Intersight is the cloud-based management platform for all Cisco UCS infrastructure. For AI clusters, it provides: - Server Profile templates — apply identical BIOS, vNIC, storage policies to 100 nodes at once - Workflow automation — multi-step provisioning workflows (rack → configure → validate → hand off) - Telemetry and alerting — server health, fan speed, power, component failures - API-driven — everything your Intersight engineer can do in the UI, you can do in Python
# Terraform: Cisco Intersight Server Profile for AI node (abridged)
# Manages full lifecycle: physical server → configured AI node

resource "intersight_server_profile" "ai_training_node" {
  name           = "ai-train-${var.node_index}"
  description    = "AI Training Node - H100 SXM5 Configuration"
  target_platform = "FIAttached"

  # Attach pre-built policy bundles
  policy_bucket {
    moid        = intersight_bios_policy.ai_optimized.moid
    object_type = "bios.Policy"
  }
  policy_bucket {
    moid        = intersight_vnic_lan_connectivity_policy.rdma_lan.moid
    object_type = "vnic.LanConnectivityPolicy"
  }
  policy_bucket {
    moid        = intersight_storage_storage_policy.nvme_local.moid
    object_type = "storage.StoragePolicy"
  }

  tags = [
    { key = "ClusterRole",   value = "gpu-training" },
    { key = "ManagedBy",     value = "terraform" },
    { key = "ClusterName",   value = var.cluster_name }
  ]
}
Infrastructure-as-Code Stack
Automation Stack
├── Terraform
│   ├── intersight provider  → UCS server profiles, BIOS, vNIC, storage policies
│   ├── openshift provider   → cluster install config, machine sets, operator subscriptions
│   └── helm provider        → GPU Operator, Network Operator, monitoring stack
├── Ansible
│   ├── OS baseline          → RHCOS tuning, kernel parameters, hugepages
│   ├── NVMe-oF initiators   → multipath configuration for storage fabric
│   ├── Firmware validation  → BIOS, NIC, GPU driver version checks
│   └── Day-2 runbooks       → node drain, GPU reset, fabric failover procedures
└── Python
    ├── Intersight SDK       → custom workflows, telemetry correlation
    ├── Kubernetes API       → workload placement, quota management
    └── Monitoring pipelines → GPU health scoring, proactive alerting
Intelligent Day-2 Operations with Intersight Automation
One of the highest-value automation investments on large clusters is connecting Intersight telemetry to automated remediation. Instead of a human reading a Grafana alert at 2 AM:
# Python: Automated GPU node health scoring + remediation trigger
# Runs as a scheduled job, feeds into PagerDuty and auto-remediation

import intersight
from kubernetes import client as k8s_client

def evaluate_node_health(api_client, k8s_api):
    """Score every GPU node and trigger remediation if score is below threshold"""

    compute_api = intersight.ComputeApi(api_client)
    servers = compute_api.get_compute_physical_summary_list(
        filter="Tags/any(t:t/Key eq 'ClusterRole' and t/Value eq 'gpu-training')"
    )

    for server in servers.results:
        health_score = 100

        # Deduct for thermal issues
        if server.thermal == "LowerCritical" or server.thermal == "UpperCritical":
            health_score -= 50

        # Deduct for memory ECC errors
        if server.memory_summary.reachable == False:
            health_score -= 30

        # Deduct for power supply redundancy loss
        if server.power_summary.input_ac_phase1_voltage < 100:
            health_score -= 20

        # Trigger automated remediation
        if health_score < 60:
            cordon_and_drain_node(k8s_api, server.name)
            create_intersight_alert(api_client, server.moid, health_score)
            notify_ops_team(server.name, health_score)
Layer 8: Resiliency Architecture — Surviving Failures at Every Layer
Enterprise AI clusters are expected to run training jobs that take days and serve inference with 99.9%+ SLA. That requires deliberate fault tolerance design at every layer.
Resiliency Matrix
| Layer | Failure Scenario | Mitigation |
|---|---|---|
| Frontend / LB | Ingress pod crash | Multiple replicas + PodDisruptionBudget |
| Frontend / LB | Single AZ loss | Multi-zone Ingress with Anycast or GeoDNS |
| Storage | Controller failure | Dual-controller NVMe array, auto-failover |
| Storage | Training data corruption | Snapshot policy every 4h, off-array replication |
| Storage | Checkpoint loss | Write to two separate PVs (separate arrays) |
| Backend Fabric | Single switch failure | Dual-spine Nexus vPC, ECMP reroutes in <1s |
| Backend Fabric | Leaf ToR failure | Servers dual-homed to separate ToRs |
| Backend Fabric | PFC storm / deadlock | DCQCN rate limiting, watchdog timers |
| Compute | Single GPU failure | NCCL elastic training, checkpoint/restart |
| Compute | Full node failure | Kubernetes node drain, reschedule on spare node |
| Compute | Power unit failure | Dual PSU per server, N+1 PDU per rack |
| K8s Control Plane | etcd node failure | 3-node etcd in separate fault domains |
| K8s Control Plane | API server overload | Rate limiting, separate infra node pool |
High Availability Design for the OpenShift Control Plane
The OpenShift control plane must be distributed across three infrastructure nodes — no two on the same physical rack or power domain.
# MachineSet for infrastructure nodes — 3 in different AZs or racks
# Ensures etcd quorum survives any single infrastructure failure
apiVersion: machine.openshift.io/v1beta1
kind: MachineSet
metadata:
  name: ai-cluster-infra-az1
  namespace: openshift-machine-api
spec:
  replicas: 1
  selector:
    matchLabels:
      machine.openshift.io/cluster-api-machineset: ai-cluster-infra-az1
  template:
    spec:
      taints:
      - key: node-role.kubernetes.io/infra
        effect: NoSchedule
      metadata:
        labels:
          node-role.kubernetes.io/infra: ''
          topology.kubernetes.io/zone: rack-a         # Physical rack label
      providerSpec:
        value:
          # UCS server in rack A
          serverRef: ucs-infra-rackA-01
Training Job Resiliency — Elastic Fault Tolerance
A 256-GPU training job that fails because one GPU has an ECC error wastes all accumulated computation. The modern approach is elastic training with automatic checkpoint recovery.
# PyTorch Elastic Training (torchrun) — tolerates node failures mid-training
# If a node fails, NCCL detects it and torchrun respawns with remaining nodes

# Launch command on OpenShift (via a Job with indexed completion)
torchrun \
  --nproc_per_node=8 \
  --nnodes=8:32 \              # Min 8 nodes, max 32 — elastic range
  --max_restarts=3 \           # Allow 3 elastic restarts before job fails
  --rdzv_backend=c10d \
  --rdzv_endpoint=$MASTER_ADDR:29500 \
  train.py \
  --resume_from_checkpoint /checkpoints/latest
# Kubernetes Job specification for elastic distributed training
apiVersion: batch/v1
kind: Job
metadata:
  name: llm-training-run-042
  namespace: ai-training
spec:
  completions: 32           # Total workers
  parallelism: 32
  completionMode: Indexed
  backoffLimit: 3           # 3 retries on failure before job is failed
  template:
    spec:
      restartPolicy: OnFailure
      priorityClassName: ai-training-high
      tolerations:
      - key: "nvidia.com/gpu"
        operator: "Equal"
        value: "training"
        effect: "NoSchedule"
      containers:
      - name: trainer
        image: nvcr.io/nvidia/pytorch:24.01-py3
        command: ["torchrun", "--nproc_per_node=8", "train.py",
                  "--resume_from_checkpoint", "/checkpoints/latest"]
        resources:
          limits:
            nvidia.com/gpu: "8"
            mlnx_rdma: "1"
        volumeMounts:
        - name: checkpoints
          mountPath: /checkpoints
        - name: shm
          mountPath: /dev/shm
      volumes:
      - name: checkpoints
        persistentVolumeClaim:
          claimName: checkpoint-pvc
      - name: shm
        emptyDir:
          medium: Memory
          sizeLimit: "32Gi"
Network Resiliency — Surviving Fabric Events During Training
RDMA is sensitive to any network disruption. The design must handle switch failures, link flaps, and congestion events without halting training.
# On Cisco Nexus — configure RDMA failover behavior:
# If primary RDMA path fails, secondary NIC takes over in <100ms

# vPC peer-keepalive link (separate from data path — use OOB mgmt)
vpc domain 10
  peer-keepalive destination <FI-B-mgmt-ip> source <FI-A-mgmt-ip>
    vrf management
  peer-gateway                   # Acts as gateway for both VPC peers' MACs
  auto-recovery                  # Recovers from split-brain automatically

# BFD (Bidirectional Forwarding Detection) for fast link failure detection
feature bfd
interface Ethernet1/1-8
  bfd interval 100 min_rx 100 multiplier 3  # Detect failure in 300ms
The Architect's Checklist — Decisions to Make Before You Procure
Here's the real order of operations that enterprise AI architects must follow:
Phase 1: Design (Before Any Purchase Order)
 □ Define training vs inference workload ratio
 □ Size backend fabric for target GPU count × 400GbE per server
 □ Choose RoCE v2 vs InfiniBand (Cisco ecosystem = RoCE v2 with Nexus)
 □ Select storage system and size for aggregate throughput
 □ Define OpenShift cluster topology (node pools, zones, rack placement)
 □ Define GPU resource management strategy (MIG vs time-slicing per workload)

Phase 2: Procurement (In This Order)
 □ Network switches (long lead time — order first)
 □ Storage arrays
 □ Cisco UCS servers + VIC adapters
 □ NVIDIA GPUs (SXM5 vs PCIe based on training/inference split)
 □ Cables, optics, PDUs, rack space

Phase 3: Infrastructure Deploy
 □ Rack and cable per physical topology design
 □ Validate cabling with LLDP/CDP neighbor verification
 □ Configure Nexus QoS: PFC, ECN, DSCP markings
 □ Validate RoCE bandwidth: ib_write_bw test node-to-node
 □ Configure UCS Server Profiles via Intersight (BIOS, vNIC policies)

Phase 4: OpenShift + GPU Stack
 □ Deploy OpenShift 4.x on GPU node pool
 □ Apply node taints and labels per pool
 □ Install Node Feature Discovery (NFD)
 □ Install NVIDIA GPU Operator (driver, toolkit, device plugin, DCGM)
 □ Install NVIDIA Network Operator (SR-IOV, RDMA, Multus CNI)
 □ Configure MIG profiles on inference nodes
 □ Deploy ResourceQuotas and PriorityClasses per team namespace
 □ Configure HPA for inference deployments

Phase 5: Observability + Automation
 □ Deploy Prometheus + Grafana (OpenShift monitoring stack)
 □ Add DCGM Exporter ServiceMonitor
 □ Configure Prometheus alerts for GPU health metrics
 □ Build Intersight telemetry correlation pipeline
 □ Codify all configuration as Terraform/Ansible (IaC from day one)
The Most Common Mistakes Enterprise Teams Make
After dozens of enterprise AI deployments at Cisco, these are the patterns that consistently cause pain:
-
Buying GPUs before designing the network. RDMA-capable switches have 12–16 week lead times. GPU decisions get made first because they're visible, network decisions come second. It should be the reverse.
-
Treating storage as an afterthought. "We have a SAN" is not a storage strategy for AI. Enterprise SANs are block storage optimized for random IOPS. AI training needs parallel streaming reads at 1+ TB/s aggregate. These are different systems.
-
Defaulting to the most permissive QoS settings. Leaving PFC in "auto" or skipping ECN configuration means your RDMA fabric will have occasional packet drops — which cause NCCL to stall and recovers slowly. One packet drop on a 1000-GPU job can waste 30 seconds of compute across the entire cluster.
-
Skipping NFD and running GPU Operator in default mode. NFD is what tells Kubernetes what hardware lives on which nodes. Without it, GPU-aware scheduling is a coin flip.
-
Not separating inference and training node pools. A training job that lands on an inference node (or vice versa) disrupts both. Taints and tolerations are not optional in multi-tenant AI clusters.
-
Ignoring MIG for inference. Running one model replica per full H100 is expensive and wasteful. With MIG 1g.10gb, one H100 runs 7 independent inference services with hard GPU resource isolation. This is a 7x density improvement for inference-optimized deployments.
-
Manual Day-2 operations. At 100+ GPU nodes, a human checking Grafana dashboards and SSHing to nodes doesn't scale. Automated health scoring, node cordoning, and checkpoint recovery must be built in from day one — not bolted on after the first failure.
-
Not testing checkpoint recovery before production training. The first time your team discovers that checkpoint recovery doesn't work should not be during a 72-hour training run.
Where to Start
If you're beginning your enterprise AI infrastructure journey, this is the sequence that actually works:
Week 1–2: Design - Define workload types and scale targets - Design Cisco Nexus fabric topology (leaf count, spine, uplinks per server) - Select storage system and validate throughput numbers with vendor
Week 3–4: Procurement + Network - Place switch and cable orders immediately - Configure Nexus QoS policy and validate with ib_write_bw between test nodes - Begin UCS server profile design in Intersight
Month 2: Platform Deploy
- Deploy OpenShift with separate GPU node pools
- Apply NFD → GPU Operator → Network Operator in that order
- Configure MIG, SR-IOV, Multus CNI
- Validate GPU resources visible in kubectl describe node
Month 3: Workloads + Operations - Deploy first training job with checkpoint/recovery enabled - Deploy inference services with MIG slices and HPA - Stand up Prometheus + DCGM + Grafana + alerts - Run full failure simulation: kill a switch, kill a node, kill a storage controller — verify recovery
Cisco Validated Design: The RAG pipeline layer on top of this infrastructure stack is fully documented in the CVD I co-authored: FlashStack for Enterprise RAG Pipeline with NVIDIA NIM, NIM Operator, and RAG Blueprint — a validated, end-to-end architecture for deploying enterprise RAG on Cisco UCS X-Series with Pure Storage FlashArray/FlashBlade, NVAIE, and NIM microservices on OpenShift. Published May 2025.
What's Coming Next
In upcoming posts I'll go deep on each layer: - RoCE v2 fabric tuning on Cisco Nexus — PFC, ECN, DCQCN, and why buffer depth matters more than raw bandwidth - NVIDIA MIG in production — designing multi-tenant inference capacity plans on shared H100 clusters - Automating Cisco Intersight with Python — real SDK code from real enterprise deployments - OpenShift AI (RHOAI) for MLOps — model serving, pipelines, and experiment tracking on top of GPU clusters - Fault injection and chaos testing — how to validate your AI cluster's resiliency before you need it to matter
Have questions about AI infrastructure design for your organization? I'm always happy to discuss — get in touch or connect on LinkedIn.